Evaluation of the results obtained at the test event indicate that there may be a tiny performance difference between Toppers equipped with transom mainsheets and with the experimental centre mainsheet system, and that the centre mainsheet system was fractionally slower. The difference noted was approximately 20 seconds per hour. The difference noted was only marginally statistically significant and was tiny compared to the actual variation in finishing times in each race, which was about 2 minutes 40 seconds per hour.
The boats were divided into two groups of 5, one group with aft mainsheet and one with centre mainsheet. The sailors - all former GB National squad level helms with current centre mainsheet boat experience, were paired off in pairs of roughly equal size. Each pair swapped boats between each race so each sailor did equal numbers of races with aft and centre mainsheet. In addition each pair changed to a different pair of boats between the two sets of four races, so as far as possible other variations were minimised.
The sailors were racing for a individual prize for the event, and the competition was hot. As might be expected with a group of very even experience and skill the racing was extremely tight. As can be seen all races finished within a very short space of time, and boats often finished within a second of each other over 20 minute races.
The raw race results in terms of elapsed time for each boat are shown below.
Table 1 - Race results - elapsed time.
| Race 1 | Race 2 | Race 3 | Race 4 | ||||||
| Sail No | Mainsheet | Elapsed Time | Elapsed Time | Elapsed Time | Elapsed Time | ||||
| 0 | Centre | 1116 | 1196 | 1284 | 1304 | ||||
| 1 | Centre | 1116 | 1199 | 1274 | 1234 | ||||
| 3 | Centre | 1088 | 1168 | 1347 | 1254 | ||||
| 4 | Centre | 1172 | 1263 | 1289 | 1137 | ||||
| 5 | Centre | 1098 | 1265 | 1365 | 1268 | ||||
| 2 | Transom | 1076 | 1203 | 1200 | 1242 | ||||
| 6 | Transom | 1065 | 1228 | 1253 | 1282 | ||||
| 7 | Transom | 1088 | 1214 | 1229 | 1172 | ||||
| 94 | Transom | 1105 | 1313 | 1244 | 1295 | ||||
| 9 | Transom | 1105 | 1248 | 1279 | 1213 | ||||
| Race 5 | Race 6 | Race 7 | Race 8 | ||||||
| Sail No | Mainsheet | Elapsed Time | Elapsed Time | Elapsed Time | Elapsed Time | ||||
| 0 | Centre | 1151 | 1123 | 1125 | 1067 | ||||
| 1 | Centre | 1169 | 1101 | 1129 | 1005 | ||||
| 3 | Centre | 1237 | 1102 | 1138 | 1075 | ||||
| 4 | Centre | 1125 | 1119 | 1134 | 1011 | ||||
| 5 | Centre | 1156 | 1136 | 1061 | 1015 | ||||
| 2 | Transom | 1195 | 1130 | 1147 | 993 | ||||
| 6 | Transom | 1170 | 1144 | 1122 | 1039 | ||||
| 7 | Transom | 1131 | 1139 | 1155 | 1035 | ||||
| 94 | Transom | 1109 | 1114 | 1134 | 1047 | ||||
| 9 | Transom | 1210 | 1110 | 1114 | 1030 | ||||
I must confess that I'm not a professional statistician and college was many years ago. The data analysis was conducted as follows.
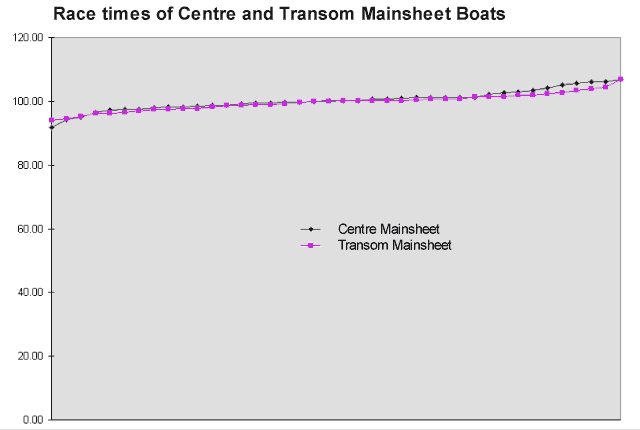
Firstly in order to normalise the times between fleets each finishing time was converted into a percentage of the mean elapsed time for the race. This made the results comparable for each race. If the results are combined for each chart type and charted the results are as follows. Note that a low score means a faster time.
Chart 1 - Elapsed times for each fleet corrected for varying race length.

Its quite obvious from cursory glance at this chart that the performance of the two mainsheet systems was very similar, and the difference was small compared to the apparent skill range of even this very homogeneous fleet.
Controls
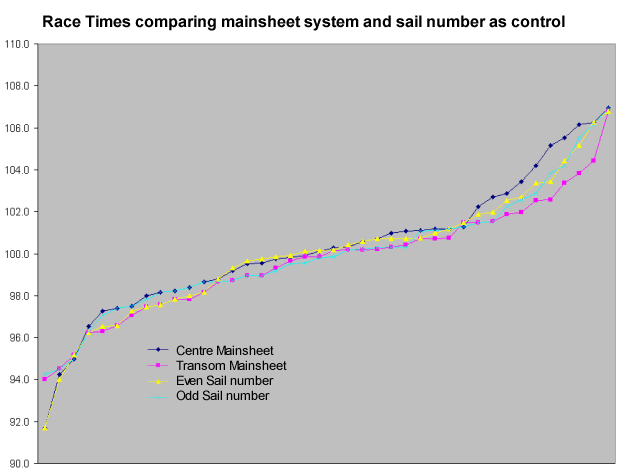
In order to provide a control for the accuracy of the data a second chart has been drawn, which charts both the mainsheet systems and boats with odd and even sail numbers. The object of this is to provide a control showing the sort of variation in results one would expect at random.
Chart 2 Elapsed Times for Centre and Transom Main boats Compared with Elapsed Times for boats with odd and even sail numbers.

As can be seen there is still considerable variation between the results for odd and even sail numbers. There is a slight suggestion that sailors having a poor race did slightly worse with the centre mainsheet system.
In order to consider things in a little more detail some basic numerical analysis was taken. Using MS Excel a T-Test for the two ranges of data was calculated. This is a statistical technique which seeks to establish the probability that there is a specified relationship between two sets of information. In the case the test was whether there was any difference between the two sets of figures. The results are as follows.
Table 2 - T Test evaluation of race data
| t-Test: Two-Sample Assuming Unequal Variances | ||
| Centre Main | Transom Main | |
| Mean | 100.30 | 99.70 |
| Variance | 10.65 | 7.35 |
| Observations | 40.00 | 40.00 |
| Hypothesised Mean Difference | 0.00 | |
| df | 75.00 | |
| t Stat | 0.89 | |
| P(T<=t) one-tail | 0.19 | |
| t Critical one-tail | 1.67 | |
| P(T<=t) two-tail | 0.38 | |
| t Critical two-tail | 1.99 | |
| Odd Sail No | Even Sail no | |
| Mean | 100.01 | 99.99 |
| Variance | 9.83 | 8.35 |
| Observations | 40.00 | 40.00 |
| Hypothesised Mean Difference | 0.00 | |
| df | 77.00 | |
| t Stat | 0.02 | |
| P(T<=t) one-tail | 0.49 | |
| t Critical one-tail | 1.66 | |
| P(T<=t) two-tail | 0.98 | |
| t Critical two-tail | 1.99 | |
A more practised statistician will be able to give you a better evaluation of this data, but as I understand it there is a 38% chance that the sets of results for the different mainsheet systems are not meaningfully different, and a 98% chance that there is no difference for the odd and even sail numbers. Note the double negative, a inevitable result of this sort of statistical analysis.
This does indicate a probable, but by no means certain, difference in performance between the two mainsheet systems on the day. The difference is not large though, just over half of one percent of race elapsed time or about twenty seconds per hour. The sailors, on the other hand, had elapsed times varying up to around ten percent. Its worth noting that while the various helms all have significant centre main experience, only one had ever sailed a Topper with a centre mainsheet before, whereas they all had many hours of experience with the transom main on the Topper. One would therefore expect the helms to be fractionally slower with the centre main as they gain experience of the precise feel of the Topper with it and to be more inconsistent in their sailing, perhaps making more errors. The greater variance (amount of variation in the results) for the centre mainsheet results is what one would expect with a slightly unfamiliar system, and this observation is backed up by the results for the control data. Some support to this hypothesis is also given when it is considered that the chart shows that the main difference in performance was when sailors were having a poor race. On the other hand the best race performance of the day was also in a centre main boat. It needs to be noted that this difference is only visible with the detailed statistical analysis. Observing races on the water there was no noticeable difference.
Five years on the centre mainsheet is pretty much universal at the top of the Topper fleet. I can well understand the Builder's and class association's desire to introduce the centre main in view of the way the Laser 4.7 was being promoted against it at the time. I can less understand the widespread adoption of a demonstrably slower means of sailing the boat, although I'll admit the results haven't inspired me to put an aft main on my International Canoe!
© Jim Champ, December 16th 2002, 2007